Issues in Earth Science
Eww, There s Some Geology in my Fiction!
Issue 20, Nov 2025
Teacher Resources
Suggestions for Activities and Discussions to accompany Readings of
A True Original by Mary Ibe
Statistical Thinking
In this issue of Teacher Resources, we are going to address the important idea of statistical uncertainty. In science, no measurement is ever exact, and so scientists need to account for how much uncertainty there is in their measurements. In addition to measurement uncertainty, uncertainty can arise from true variation in real-world samples (no two samples will ever be exactly alike, even if taken from the same area). How can scientists take this variation and uncertainty into account when comparing different samples, like the comparison between the modern and older shrimp chimney samples in the story A True Original?
Often, scientists use statistical analysis, deriving values such as standard deviation, to facilitate comparisons. The mathematics involved in this process often discourages teachers from introducing their students to this critically important idea of science, which leaves a giant hole in the students' understanding of the nature of scientific inquiry. However, an understanding of statistical uncertainty does not require a lot of math or equations! A colleague of mine who worked extensively with statistical variation within the context of real Moon samples and his favorite analysis method (Instrumental Neutron Activation Analysis, or INAA) once said If you can t see the difference on a graph, then all the statistical calculations in the world aren t going to convince people that a variation is real.
So, let s think about understanding statistics using graphs!
Part 1: Initial puzzle and conceptual analysis
The story, A True Original, talks about measuring some type of sulfates. Sulfur present as sulfides can affect pH, which might affect environment, and, in addition, many toxic metals, like arsenic, might be present in association with sulfur.
Let s suppose that we analyze the arsenic sulfate concentration in a sample of the modern chimney and compare it to a sample of an older chimney. Suppose that the analyses of the old shrimp chimneys gave a result of 10 and a sample from a new chimney gave a result of 12. Are these different? What do you think?
The best answer is: I have no idea from this information!
There are a lot problems with the question, are these different? First of all, we are given no units. 10 or 12 what? Are we comparing apples to apples or apples to oranges? In science, numbers have little meaning until they are associated with a unit. For example, perhaps it is 10 percent arsenic sulfate and 12 parts per million arsenic sulfate. Clearly, the 10 is much, much bigger (by 4 orders of magnitude) than the 12! However, let s suppose they are both in the same units, say parts per million. Now, can you say that one is different from the other?
Still no!
From these data you have no understanding of either the real-world, natural variation of arsenic sulfate or the statistical uncertainty associated with the measurements. For example, perhaps the real-world natural variation large enough that the 12ppm measurement is not meaningfully different from 10ppm measurement. Regarding the statistical uncertainty, maybe the best that you can do with measuring is to get within about 5 parts per million of the true value. So, one time you might measure 10, but the next time it might be 5 and the time after than 15. You can see that from the reported data of 10 and 12 alone, you can t know whether or not 10 is meaningfully different from 12.
Suppose that I determine the average value of 5 analyses for each of the old and new samples. If the average concentrations come out at 10ppm and 12ppm, what can I say about whether they are different?
Still, nothing. Without knowing the values of the individual analyses, the average provides no information in addition to a single analysis! When students take an average and then throw away the individual values, they have just thrown away their most important data!
Part 2: Plotting and interpretation of a single chemical component
So, what is one to do? One method of assessing uncertainty is to compare multiple analyses to each other and/or compare multiple samples to each other. Comparing multiple analyses of the same sample allows one to determine analytical uncertainty, and comparing multiple samples allows one to evaluate real variation between samples.
Consider the following sets of data that (in our pretend scenario) were derived from the shrimp chimneys. To evaluate the uncertainty in a graphical way, plot these data along a line (see the line for each scenario below), using different symbols for the old and new chimneys, and then say whether you think that the values:
1) are different,
2) might be different but we can t be sure, or
3) show no indication of being different.
Scenario 1 data for arsenic sulfate.
Old Chimney: 8ppm, 9ppm, 6ppm, 20ppm, 10ppm, 13ppm, 18ppm
New Chimney: 15ppm, 10ppm, 17ppm, 7ppm, 12ppm, 9ppm, 14ppm

Interpretation: Based on your graph, do you think the values are different or not? Frame your analysis as one of the following: the values are different, the values might be different but we can t be sure, or the values show no indication of being different. Your analysis should include an explanation of why do you think that?
POSSIBLE RESPONSE: For this problem, the average concentrations are exactly the same (12ppm), making the interpretation that they are not obviously different...rather obvious. However, the variation in values is quite large relative to the average concentration and so the true values might be quite different from each other, and we would not be able to detect it.
Scenario 2 data for arsenic sulfate.
Old Chimney: 8ppm, 9ppm, 6ppm, 20ppm, 10ppm, 13ppm, 18ppm
New Chimney: 13ppm, 8ppm, 15ppm, 5ppm, 10ppm, 7ppm, 12ppm

Interpretation: Based on your graph, do you think the values are different or not? Frame your analysis as one of the following: the values are different, the values might be different but we can t be sure, or the values show no indication of being different. Your analysis should include an explanation of why do you think that?
POSSIBLE RESPONSE: For this problem the average concentrations are different (12ppm for old, 10ppm for new), but the variation in the values is large such that the values overlap a lot on the line above. Consequently, we might reasonably conclude that the values are not meaningfully different.
Scenario 3 data for arsenic sulfate.
Old Chimney: 12ppm, 12ppm, 10ppm, 14ppm, 10ppm, 13ppm, 13ppm
New Chimney: 10ppm, 11ppm, 12ppm, 9ppm, 10ppm, 9ppm, 9ppm
Interpretation: Based on your graph, do you think the values are different or not? Frame your analysis as one of the following: the values are different, the values might be different but we can t be sure, or the values show no indication of being different. Your analysis should include an explanation of why do you think that?
POSSIBLE RESPONSE: For this problem the average concentrations are different (12ppm for old, 10ppm for new), but the variation in the values is much smaller than in the previous scenario, so that we might reasonably conclude that the values might be meaningfully different. We should also recognize that the values do not support an interpretation that the modern chimney contamination can explain the ecological issues in the story, because the old values are actually higher than the new values.
Scenario 4 data for arsenic sulphate.
Old Chimney: 10ppm, 10ppm, 11ppm, 10ppm, 10ppm, 10ppm, 9ppm
New Chimney: 12ppm, 12ppm, 12ppm, 13ppm, 11ppm, 11ppm, 13ppm
Interpretation: Based on your graph, do you think the values are different or not? Frame your analysis as one of the following: the values are different, the values might be different but we can t be sure, or the values show no indication of being different. Your analysis should include an explanation of why do you think that?
POSSIBLE RESPONSE: For this problem the average concentrations are different (10ppm for old, 12ppm for new), and, although there is still some overlap of values, the maximum variation from the average (+/- 1ppm) is smaller than the difference between them (2ppm) and so we might reasonably conclude that the values are indeed meaningfully different. In this case, the difference might explain the ecological issues in the story, because the old values are lower than the new values.
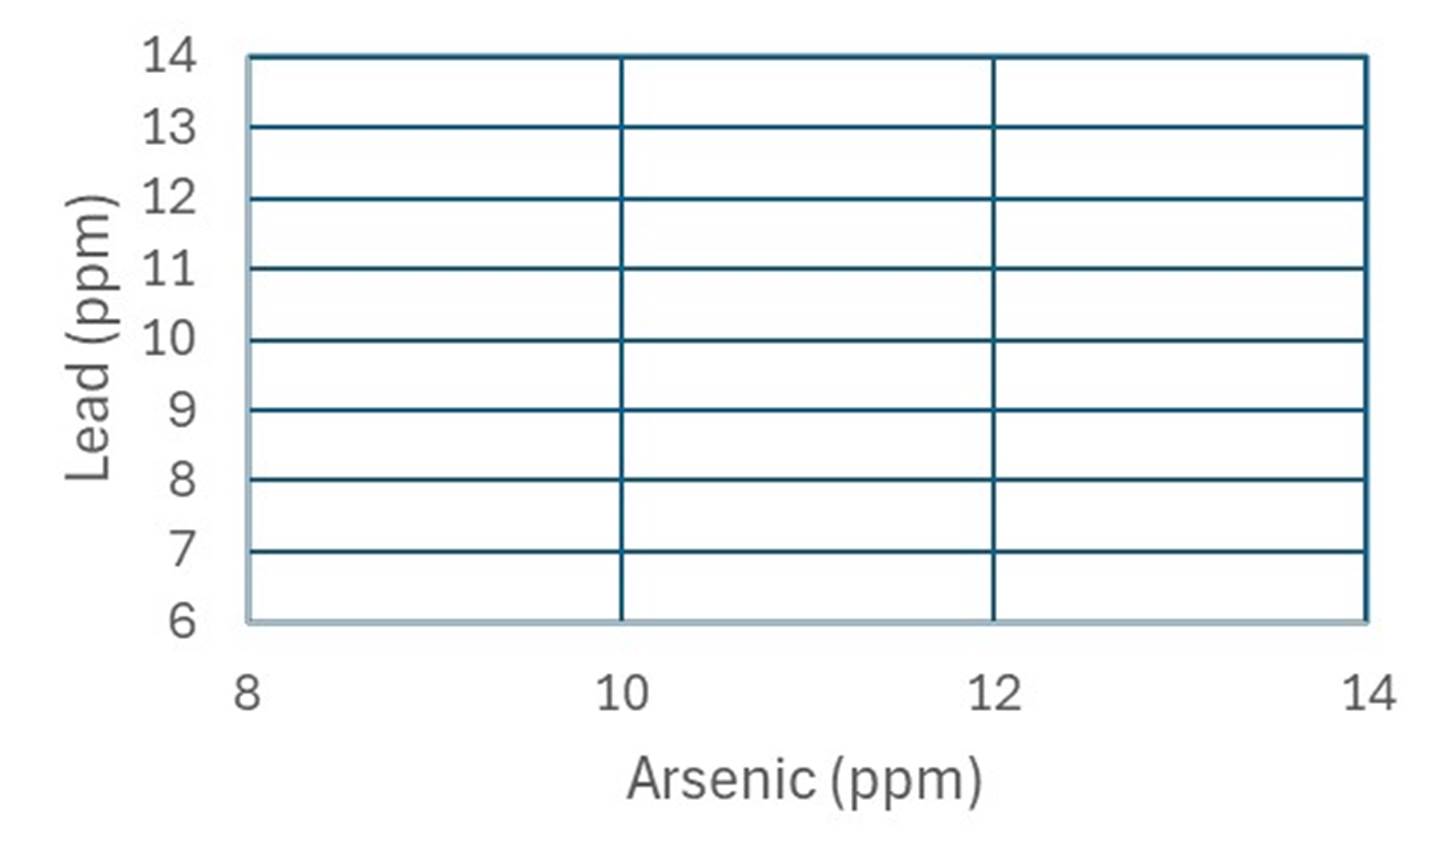
Part 2: Plotting and interpretation of multiple chemical components
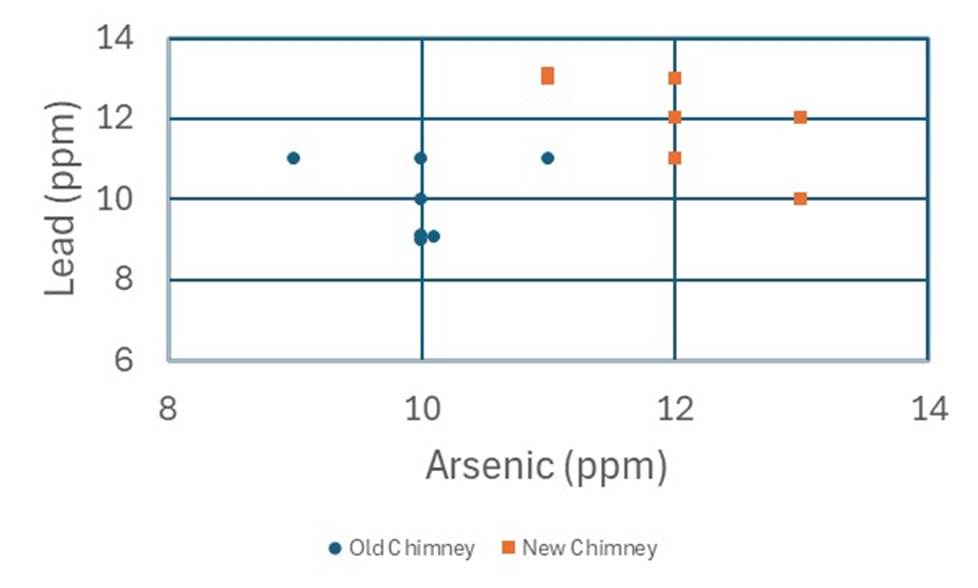
Scenario 5 data for arsenic sulfate AND lead sulfate.
Often, we can get greater separation of values by considering additional chemical components. Let s consider a situation where we also think about lead sulfate concentration. We can plot two chemical components on an X-Y diagram like that shown below (as before, use different symbols for the old and new chimneys).
Old Chimney:
Arsenic Lead
10ppm 9ppm
10ppm 9ppm
11ppm 11ppm
10ppm 10ppm
10ppm 11ppm
10ppm 9ppm
9ppm 11ppm
New Chimney:
Arsenic Lead
12ppm 12ppm
12ppm 13ppm
12ppm 11ppm
13ppm 10ppm
11ppm 13ppm
11ppm 13ppm
13ppm 12ppm
Interpretation: Based on your graph, do you think the values are different or not. Frame your analysis as one of the following: the values are different, the values might be different but we can t be sure, or the values show no indication of being different. Your analysis should include an explanation of why do you think that?
POSSIBLE REPONSE: The arsenic data have not changed from Scenario 4, and so the conclusions above still apply, but it might be easier to see the separation between the old and new chimneys when plotted this way. Also, we can see that both arsenic and lead are increased in the newer chimneys, adding confidence to our conclusion that there has been an environmental impact in this area between the two time periods.
Summary
Without understanding statistical analysis, students cannot understand investigative science in any meaningful way. Statistical thinking is essential to analysis of data. However, it is not necessary to teach students the mathematics of statistics before engaging them in statistical thinking in the analysis of data.
Connecting the Next Generation Science Standards
The graphing, data analysis, and interpretation activities above support the following NGSS performance expectations:
MS-ESS2-1
MS-ESS3-3
HS-ESS3-6
Students can exercise skills in the practices of:
1. Asking questions and defining problems
2. Analyzing and interpreting data
3. Using math and computational thinking
4. Engaging in arguing from evidence
5. Obtaining, evaluating and communicating information
Students experience the crosscutting concepts of:
1. Patterns
2. Scale, Proportion and Quantity
![]()
_________________________________________________________________
The Teacher Resources for A True Original are written by Russ and Mary Colson, authors of Learning to Read the Earth and Sky.
Return to A True Original by Mary Ibe
Return to Eww, There s Some Geology in My Fiction.
Find more essays, games, and stories at
2025 Issues in Earth Science